How to Trade Indices and Stocks in Forex?

There are multiple investment instruments used to evaluate savings in financial markets. Time deposit accounts, mutual funds, stocks, derivatives, and more. Each investment vehicle has many features and advantages in itself. Is it possible to invest in stocks and indices on the forex market? Can the transactions be opened with using leverage?

The answer to our questions YES, can be invested in stocks and indices in forex markets. Let's look at how this is now.


tradeacademia


We open an account at the bank or brokerage houses to open trading on the Forex market. With this account, we can track the price of more than 100 products and evaluate the positions. The parities, commodities, stocks and indices are examples of products that can be traded in forex.

Indices is a stock market which has belonging a certain number of shares in a country.

For example; If we look for ABD, The name of the index followed first is Dow jones. It includes the big thirty companies.

Within Dow jones, there are McDonald's, Microsoft, American Express, The Coca-Cola Company and so on companies. The increase in the value of each share constitutes an increase in the total index value.

In the same way, we see similar value formations according to the price increase and decrease, of the shares in the other indices.

In Forex market is evaluated in to foreign stocks and indices. Therefore, in order to be able to trade in these products, it is necessary to follow the foreign markets in the best way.

Usage characteristics of foreign stocks and indices in the forex market;

 Click here to open an account and start forex trading immediately.

Leverage


Allowing more transaction in the market than in your balance is means, leverage. If we are using leverage in the foreign exchange market, we can use leverage in equities and indices too. We can also deal with the leverage in stocks and indices as well. You can learn how much leverage you can transaction with your account by asking the institution you are working with.

Transaction times


Forex is a market that is open 24 hours a day, 5 days a week. While there is no term in the currency, there is a certain maturity / session for some commodities, stocks and indices.

For example; DAX30- It is open for forex trading between 09:00 am and 23:00 am in the morning.

Apple Inc. (US) - It is open between 16: 30-23: 00.

Contract size


The size of the process opened to evaluate a 1-lot transaction is called the contract size. The sizes may differ according to the product types.

For example;

A 1-lot transaction in currencies is 100,000 units. A 1-lot transaction for EURUSD is a 100,000 euro transaction.

In the case of stocks and indices, the contract sizes are different. Each 1 lot share and contract size is 1 unit.

So; If the price of the index is 17800 when the transaction is opened in the 1-lot Dowjns index; it is means the $ 17800 transaction is open.

Swap


If you make a BUY or SELL in Forex trading and hold the position the next day, your account will be swapped. It reflects the different swap costs in each case. Shares and indices are reflected in different swap balances.

You can get confirmation of how much swap is reflected on the phone by the institution. Or you can controlled by entering the properties field from the market watch screen on the platform . Apart from these, the swap price of the weekend can be reflected on a different day from the foreign exchange.

Lot size


For many parities, trading with microrolot is possible, while some institutions in stocks and indices do not allow micro and minilot and at least 1 lot transaction has to be entered. You can find out from your bank or broker how many lots of transactions you can open.

Some indices and stocks and the countries they belong to;

Indices
CAC40
FRANCE
DAX30
GERMANY
DOWJNS
ABD
NASDAQ
ABD
RSL200
ABD
OMXS30
SWEDISH
Shares
Apple
ABD
Coca Cola
ABD
Facebook
ABD
Vodafone
ENGLAND
Peogeot
FRANCE
BMW
GERMANY

 Click here to open an account and start forex trading immediately.

What is Pending Order in Forex?

Forex, the world's largest market, is one of the most preferred investment vehicles with many advantages. The leverage ratio, which allows the player to trade up to 100 times, has many advantages such as bidirectional trading which can be done by both buying and selling, and 5/24 open market. Trading in more than 100 currency pairs, commodities, stocks and indexes is not as difficult as it is thought to be. Knowing the key terms and screen usage required to open a transaction will quickly bring you success in this market.

Pending orders are one of the most important terms used to open transactions. Let's take a closer look at what the order is and how it is used.

 Click here to open an account and start forex trading immediately.

Pending order


Instead of evaluating the transaction at a current price in the market, it is used to give the order to open the transaction from the price level that we expect to occur in the future or the price levels that we set manually.

Fx transactions can be done 5 days 24 hours on weekdays.You can take advantage of opportunities at any time, you can see your instant profit / loss on your account, you can follow the finance market closely. How can I open the order when the price reaches the level I want while I am not at the screen?Is it possible to give automatic orders without accessing the platform? Can I send an upcoming order?

YES for all of these questions. Now let's take a look at how to do this step-by-step on the screen.

We talked about how to open a new order at the current price in our article titled "How to use Meta Trader 4?". Those who want to remember can access it by clicking the tittle.


  • Click on the new order, 
  • Instead of the Market execution opened by clicking with the mouse on the field that appears as type, let us select the Pending Order tab written just below. 
  • Fill in the part indicated in the pending order statement. 
  • TYPE: Type of pending orders to be entered 
  • AT PRICE: The price we want to place the order.(pending order) 
  • EXPIRY: Pending order validity period. If the box is checked the order is valid up to specified the time in the box. 
  • PLACE: Once the “Place” button is pressed, the instruction is sent directly. 

tradeacademia


Pending order types;


  • Buy Stop - an order to open a Buy position at a higher price than the price at the moment of placing the order;
  • Sell Stop - an order to open a Sell position at a lower price than the price at the moment of placing the order;
  • Buy Limit - an order to open a Buy position at a lower price than the price at the moment of placing the order;
  • Sell Limit - an order to open a Sell position at a higher price than the price at the moment of placing the order.


By way of example,

Imagine you want to enter pending orders in EURUSD.

Get the current market price 1,08.

If you want to enter BUY order from 1,06 - BUY LIMIT (If price fall to 1,06, BUY it from 1,06)

If you want to BUY from 1,10 - BUY STOP (Buy, if it goes to 1,10)

If you want to enter SELL order from 1,11 - SELL LIMIT (SELL, if it goes to 1,11)

If you want to enter SELL orders from 1,07, you need to enter SELL STOP (SELL, if it goes to 1,07).

As can be understood from the examples mentioned above, some orders can be bought at a price above the current price, or sold at a price below the current price. Well, why do we enter pending orders when we have better current price?

The reason is, they think that the price will fall or will rising up even more to the technical analysis they maked. Investors who want to open trading by using the levels of support and resistance are often prefer for these reasons.

One of the biggest advantages of the pending order is that orders can be processed from the points we have determined without having to be at the top of the screen constantly and without following the market instantly. In this way, while our daily lives continue, we can gain profits by trading on the market.

There are a few things to be aware of when using pending orders and pending order forex strategy. One is control over whether more than one pending order maintains the adequacy of the existing margin level, and the other is difficult to follow if the order is realized. For this reason, after entering the order, it is necessary to monitor whether or not the process is performed at certain intervals. In this way, we do not encounter a negative surprise.

 Click here to open an account and start forex trading immediately.

Base Currency and Quote Currency

   Forex market has some key terms used for trading like base currency and quote currency. Having an understanding of what the terms are and having an understanding of how forex terms are used in the transaction ensures that we get the most out of the investment tools.

The most frequently encountered terms when trading in the foreign exchange market are base currency and quote currency . Let's look closely at what these terms mean in order to achieve numerical success in Forex.

tradeacademia


 Click here to open an account and start forex trading immediately.

Base Currency


The base currency is the currency that is initially read on the left side of the parity. It is also known as the primary currency.
For example;

The base currency for the USDCAD parity is the dollar on the left side of the parity. It is the value of the dollar against the canadian dollar which is meant to be mentioned.

So, when the USD / CAD rises to 1,35 from 1,33, the dollar is appreciating against the cad.

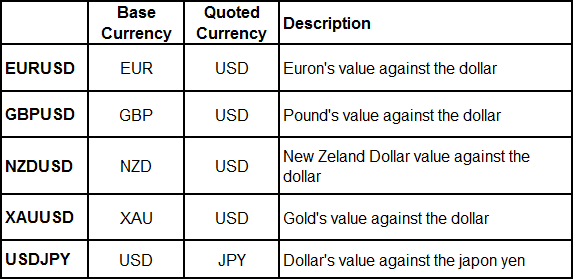
If we give an example for EURUSD, the base currency is the euro. In the use of this parity, the value of the euro against the dollar is measured.


Quote Currency(Counter currency)


The quote currency is the currency located on the right side of the parity. It is also known as the second currency.

For example;

USDJPY- is the value of the dollar versus the yen. The base currency is the dollar, the yen is the counter currency.

Currency pairs measure the relative value of two currencies. Regardless of currency, the result is the same. For this reason we give a general example;

XXX/YYY

XXX: Base currency (primary currency)

YYY: Quote currency (second currency)

Reading GBPUSD = 1.25 means that _1 is equal to $1.25. This directly says that in order to purchase _1, a buyer must pay $1.25. The currency pair quotation is read in the same manner when selling the base currency.

If a seller wants to sell _1, he will get $1.25 for it.


Base Currency and Quote Currency


 Click here to open an account and start forex trading immediately.


When doing technical analysis and fundamental analysis, it is necessary to know what the base currency and the counter currency mean, and the market should interpret this information at its best.

If you want to make your investment in the best way and evaluate profitable transactions, you have to know about the markets, you have to read and research very much. We are trying to provide you with all the basic level of forex and platform information you need.

Our goal is to show that everyone who is laboring can succeed in the fx world.For this reason, you should believe that you can get high profit rates that seem impossible, and you should do the necessary work for max.

If you want to have detailed information about forex, please continue to follow our website...

What are the Abbreviations and Nicknames of Currencies?

 In order to be able to trade on the Forex market, hundreds of products such as commodities such as currency pairs, gold, oil, and foreign stocks like vodafone, bmw are used on all world stock exchanges. Each of these products, which are processed by the institutions through their own special platforms, have their own names and codes. Thanks to these codes, the products are recognized and easily remembered.


tradeacademia

   If you want to find, what are abbreviations for international currencies, and what are the aliases of the most commonly used currencies, you can read our text.

   Currency types are referred to by various symbols. These symbols are followed by names and abbreviations. In many articles and analyzes you read, you can see these abbreviations and nicknames. If you say that, 'I do not understand what abbreviations are used in market text.i want to use the nickname in the same way', you might want to look at the table below.


forex basket

 Click here to open an account and start forex trading immediately.
  • The first two letters of the three-letter abbreviation that we see in the symbols usually identify the country of that currency, while the last letter represents the currency of that country.
  • Nicknames are mostly used among the public. They are made up of easy-to-remember names that are often used due to speech or writing habits.

    
Let's take a look at the abbreviations and nicknames of the most used products in the Forex market;

Parities; Measures the value of two currency pairs. If we look at the parities as symbols, the two foreign currencies are written next to each other and the meaning of the left most currency is to measure the value against the right.

For example;

EURUSD- The value of the euron against to the dollar,
USDTL- The value of the dollar against to the Turkish lira, 
GBPJPY - The value of the British pound against the Japanese yen is mention and interpret in this way by on the market.

The shape of readings are;


EURUSD- Euro dollar
GBPUSD- Pound dollar
USDJPY - Dollar yen
GBPJPY – Pound yen

 Click here to open an account and start forex trading immediately.

The History of Forex

   Forex history dates from the 1970s to the present day and has become the world's largest market with daily transaction volume of about $ 5.5 trillion.
  
   Forex, known as the abbreviation of foreign exchange words, symbolizes the exchange of two currencies on its name. From the ancient times, people started to exchange goods for the first time in order to meet their needs. We can say that the first commercial transactions were started by exchanging the goods with the goods. Then, with the presence of the money, the goods were exchanged with the moneys rather than with the goods. Various methods and agreements were made in order to determine the value of money.


tradeacademia


The first agreements to measure the value of the money and determine the standard are as follows.

 Click here to open an account and start forex trading immediately.

Bretton Woods Agreement;


   With the agreement made in 1944, the International Monetary Fund (IMF) was established.Under the auspices of the IMF, all currencies were indexed according to dollar. And the dolar too was indexed according to gold. According to the Bretton Woods system, 35 usd = 1 ounce gold was determined. According to the system that constituted the bases of Forex, the value of all the currencies of all countries emerged and the money was expressed in usd and gold.


Smithsonian Agreement;


   It was signed in 1971. In this agreement, a plan was prepared to stabilize the fluctuations of European currencies among themselves. With this deal, the value of the US dollar was lowered, but after a while it was not enough but it was possible to devalue again and lose the value of the dollar by devaluation. However, because the speculative movements were intense, foreign exchange markets had to be closed down.

When the foreign exchange markets were reopened, the European and Japanese currencies were released against the dollar, and thus to the free exchange rate regime was started. In this way, the exchange rates have been determined by the market and have been liberalized.

Thanks to the liberalization of the market, investors started to exchange forex currency exchange. The exchange rates were presentation by the bank and many brokerage houses. Foreign exchange transactions are also carried out for the purpose of hedging other than for profit purposes. Many companies are saving their foreign exchange debts from the risks by this way. They open upside down positions to minimize the risks of exchange rates.

Forex is an important investment tool that people choose for many years as we have mentioned in history. It is going to seems to be prefer over the coming years because it has many features including enabling high profit rate, daily trading on weekdays, leverage and product diversity.

 Click here to open an account and start forex trading immediately.

What is Stochastic Oscillator and How is it Used?

The Stochastic Oscillator was developed by George Lane. It is an indicator that allows future technical prices to be forecast will of occur in close proximity to previous closing prices.

As in the RSI indicator, future prices are estimated by, interpreting levels from 0 to 100.


tradeacademia


 Click here to open an account and start forex trading immediately.


Features of the Stochastic Oscillator


Two lines appear on the chart as 20 and 80. These lines are overbought and oversold territories. Pricing in this range is shown using some lines on the graph. The first is the% K line and the second is the% D line.

  • % K line; The main curve is a slowed% K curve.. It uses a% K curve, which is slowed by a curve.
  • % D line; Shown in dashed lines. It is more commonly referred to as a signal line.
  • On MT4 platform, % K time interval has select as 5, deceleration 3,% D interval 3 as ready.
We can calculate the% K curve with the help of the following formula.

%K = 100(C – L5)/(H5 – L5) 


  •     C   = the most recent closing price
  •         L5  = the low of the 5 previous trading sessions
  •         H5  = the highest price traded during the same 5-day period
  •        %K = the current market rate for the currency pair
  •       %D  = 3-period moving average of %K

Interpretation of the Stochastic Oscillator;


   The closing price for the last day indicates that prices will rise if the highest value in the last 5 days is nearer.In the opposite case, prices will decrease.
It can be seen that over the 80 values ​​that are tracked within the specified time interval, it can be returned to Sales due to excessive purchases, while the value below 20 can return to Buying due to over-sales.

The incompatibilities on the price and graphics again have the same signal characteristics as on the RSI. For example, if the chart are rising while the prices are declining, it is meaning of prices will move in the opposite direction of the trend.

Since it will generate a large number of signals at the specified time interval and does not have a positive effect on the horizontal market, it is beneficial to follow the indicator for a while and determine the best time interval according to ourselves.

One of the best indicators is the Stochastic Oscillator, but a single indicator should not be adhered to when performing technical analysis in all markets. A final decision should be made using a few indicators.Of course, fundamental analysis techniques also need to be considered.

 Click here to open an account and start forex trading immediately.

What is Moving Average?

   One of the most commonly used analytical methods in the Forex market is moving averages. For estimating future prices, it is calculated by taking the average of past prices.The reason for moving average is; every new price move is included in the average.

   When moving averages are used in analysis, the lines shown on the graph can be interpreted as support and resistance level. If the price is above the average, we can say that it has create a support level of the moving avarage, and if there is a pricing below the average, it has create a resistance level of that moving avarage.

   Moving averages are an important tool for determining trends. The prices above the moving avarage may indicate that the outgoing signal is giving a signal to buy, while the lower part of the average indicates that it is giving the signal to sell.

   When two different averages are used; if the short-term average rises above the long-term average it should be interpreted as a buying signal. If it is dicrease, it means a selling signal.

For an example interpretation, you can examine the following graph.

tradeacademia


Moving averages are divided into five;


  1. Simple moving average 
  2. Weighted moving average 
  3. Exponential moving average 
  4. Triangular moving average 
  5. Variable moving average 

 Click here to open an account and start forex trading immediately.

1- Simple moving average; 


   Calculated by taking the average of all closing prices in the preferred time slot. Since each day in the past is calculated with the assumption that it has the same importance, the hit rate is lower than the other averages.

2-Weighted moving average ;


   It is an analysis method found by Welles Wilder. While the simple moving average looks at the same importance every day, the weighted moving average increases the degree of importance by giving a higher coefficient to the prices that occurred in the last days. The results are more accurate at this point.

3-Exponential moving average;


   It is a more commonly used average than the other moving average. Although the calculation is somewhat complicated, the success rate of the signals is higher.

   Today's generated price is added to yesterday's exponential moving average with a determined percentage and the present exponential moving average is found. Thus, more emphasis is placed on closing prices in recent times.

   While the exponential moving average percentage is calculated; 2 / (1 + the time period specified for moving average) formula is used.

4-Triangular moving average;


   In this avarage, the number of days in the middle of the number of days in the period we look at is given more weight.

5-Variable moving average;


  It is an exponential moving average. The difference from the other exponential moving average is that when the prices are compressed in the horizontal market, the variable moving average gives stronger signals.

 Click here to open an account and start forex trading immediately.

What is RSI-Relative Strength Index?

   There are RSI-Relative Strength Indexes among the main indicators used in trading Forex market. It is followed frequently by traders due to ease of use and signal success. We will have desribe to you, what is RSI, how to used Rsi and how to interpreted RSI on the platform.

   The RSI (Relative Strength Index) is a display published by J. Welles Wilder in 1978. Basically, prices identify overbought and oversold territories and allow us to predict where they might go.

  This indicator, which is often used when performing technical analysis, is indicated by a line with a value between 0 and 100. It compares the prices of percentage, based on the figures between these two values by calculating between the overselling days and overbought.

   The use and interpretation of these values, which are automatically calculated in Forex Meta programs, is quite simple in terms of investors. We can easily interpret and understand the underlying rationale to gain profits.

 Click here to open an account and start forex trading immediately.

Features of the RSI indicator


   RSI; It is added on the platform as arranged according to the 14 day period. However, you can change these period values ​​according to your investment strategy.

   The index shows two numerical values ​​of 30 and 70. The indicator is interpreted according to the prices that occur below or above these two values.

  • Below the 70 level, indicating that prices may fall, giving a SELL signal
  • The upward movement of the level 30 signals that the prices may rise, signaling BUY.


tradeacademia


Interpretation of the RSI indicator


   We have said that the RsI indicator is successful in determining overbought and sell territory. Let's see how we interpret it now.

   The approach to the 70 levels of the demonstrator shows that there is a lot of purchases and that downward movement is possible from these points, progressing towards the level 30 of the show, there is a lot of sales and the upward movement is likely to continue.

   In order not to make mistakes in interpreting, it is necessary to read it correctly, observing the graph well.

   If prices go above 70 line, if you enter the sales transaction by thinking about approaching the excessive buying area, you may see damage if the increase continues.

   For this reason, waiting for a period of time over the 70 line and waiting breaking the 70 lines of prices again to watch the sale process will be more correct behavior. The same applies is to decisions of buy below 30 lines.

   This indicator, which is easy to use, is often preferred among investors because it provides easy-to-understand and accurate estimates.

   In addition to the lines 70 and 30, you can also specify the level 50, which is the midpoint. To do this, right-click on the indicator with the mouse, select RSI properties, then scroll down to the Levels tab and type 50 in the Add column.

  You can get a new transaction decision by seeing the average level of the price on this page and you can have a better idea of ​​the exit point from the current transaction.

   As we have said in our previous writings, it is not right to make use of a single indicator or diver when making a decision. It is absolutely necessary to monitor more than one indicator, economic data, news and evaluate the transaction accordingly. Indicators may only give you an idea of ​​the possible course of action, but they do not guarantee any profit rate. 

 Click here to open an account and start forex trading immediately.

What are Bollinger Bands and How are They Used?

  There are many strategies and analysis methods that are used to be successful in Forex. Besides the fundamental analysis that enables the interpretation of the daily data to be followed up, technical analysis methods based on drawing individual figures and past prices are at the beginning of these strategies. One of the most frequently used indicators of technical analysis is Bollinger Bands, we have already mentioned in our previous writings. Let's take a closer look at what bollinger bands are and how they are used.

   Bollinger Bands were invented by the famous trader John Bollinger. It is one of the frequently used indicators in technical analyzes applied in financial markets. It is shown by 3 lines and these lines are followed by taking advantage of moving average. Moving averages are calculated by shifting the standard deviation value up and down.

   In Forex Meta programs, Period 20 and standard deviation value 2 are chosen. The values are applied on platforms considering the optimum rates in transaction evaluation. However, you can change these values up or down according to your own.

  • Medium Bollinger Band = 20 Daily Moving Average
  • Upper Bollinger Band = Medium Bollinger Band + 2 Standard Deviation
  • Lower Bollinger Band = Medium Bollinger Band - 2 Standard Deviation
 Click here to open an account and start forex trading immediately.

  The lines shown as lower band and upper band are strong support and resistance levels. The prices approaching the upper band line are approaching resistance, while the prices approaching the lower band approach to the support level. The prices approach these levels and their departure gives us an idea of ​​direction.

   For example; If prices are breaking up the middle bollinger band, We might think that the price could move towards the upper resistance, which is the next resistance level.

We can think that if the prices are breaking down the middle Bollinger band, the price could move towards the downward direction, which is the next support level.

If it breaks the upper band again, the idea that the continuation of the ascension will come, if it tries to force the upper band, but it does not, we might get the idea of going back to sells. Likewise, this rule applies in the lower band.


tradeacademia


  It is possible to perform technical analysis using indicators,  but alone is not enough to make a decision.It is necessary to look at what is happening in the market during the day, to follow economic conditions and data of countries, to evaluate transactions with appropriate lots and multiple indicators, data and news should be utilized when making investment decisions.

 Click here to open an account and start forex trading immediately.

Best Trading Indicators

  When analyzing the Forex trades, many analytical methods are utilized. The basic analysis interprets the economic data of the countries and the technical analysis that provides the forecasts about the future prices is the one of these methods. The indicators that help us to interpret the market in technical analysis are the most frequently used indicators and the detailed features of these indicators we will examine.

 Click here to open an account and start forex trading immediately.

  Each indicator has its own characteristics.We can have more stable and accurate information about the future prices by using these features. We can reach the most successful result by evaluating the transaction through the trial account for a while in order to choose the indicator suitable for the parity we want.

 You can see how the indicators have been added to the MT4 platform in our previous article.

tradeacademia


  There are different types of indicators depending on the frequency of the transactions you make in Forex, the type of parities and the ease of personal use. Among these, the most preferred and successful indicators are as follows.

1-Moving Average Convergence / Divergence (MACD)


   The MACD indicator was developed by Gerald Appel. It is an indicator consisting of moving averages. It allows us to have information about the direction by determining the compatibility or incompatibility of the two moving averages relative to each other.


   A 12-day short-term exponential moving average, a 26-day longer-term exponential moving average is subtracted and it is calculated in this way.The processes are followed by a 9-day exponential moving average in terms of perception and signaling of the turning movements.

MACD= EMA(12)-EMA(26)
SIGNAL=EMA(MACD,9)

tradeacademia


   Zero level is regarded as equilibrium. The signal is interpreted as a Buy signal if the line goes above this level. In case of sagging underneath is interpreted as Selling signal.

    In some cases, inconsistencies between the indicator and the price can also be used to obtain an idea. With MACD curves, prices are inversely proportional, and if there is a discrepancy, it means that the trend is over and that a fast move may be the beginning in the reverse direction.


2-Bollinger Bands (Bollinger Bands)
3-RSI (Relative Strength Index)
4-Moving Average
5-Stochastic Oscillator

 Click here to open an account and start forex trading immediately.


What is Technical Analysis?

   Analyzing the price movements in the past, evaluating with certain statistical calculation methods and estimating future prices is called technical analysis.

   All software required for technical analysis is available in MT4 and similar forex platform applications. It is possible to make these drawings and analyzes individually.

 Click here to open an account and start forex trading immediately.

   The most basic points to be aware of are support, resistance and trend drawings. Then there are many indicators that you can use to support you when you trade.


tradeacademia


   In order to open the right spot and to close the positions profitably, it is first necessary to select the trading period well. Daily, instant, weekly, etc. You can take positions according to the frequency of operations, you can use the appropriate analysis methods.

For example; An investor thinking about doing long-term trading would be wrong to make a technical analysis looking at the 5-minute charts. Conversely, if you are evaluating the short term, instant transaction, you should prefer minute chart instead of weekly, monthly charts.

   In order to be successful in the markets, a single analysis method is not sufficient. It will be rational to focus on analytics by following well the news and data flow that occurs in the whole world for the best results and it is not forgotten that it affects many factors (political, economic, technical, psychological etc ...).

   In order to better understand the technical analysis, it is useful to explain indicators, which are an integral part.


What is the indicator?


   Indicators are indexs based on technical analytics that give clues about the direction of the market when trading in Forex.

   We can say that the forex trading is more profitable by showing various figures on the graphs, which point to open, where to open the current position, which prices will be appropriate in the future.

   These indicators can be supplied in many different ways on the internet as well as in the platform used.

  Click here to open an account and start forex trading immediately.


Most used indicators are;


  • Moving Average Convergence / Divergence (MACD)
  • Bollinger Bands
  • RSI (Relative Strength Index)
  • Moving Average
  • Stochastic Oscillator

   We should not judge the indicators alone, we should not think that we will make a definite profit from transactions.

   As you know, market is affected by many factors. It is not possible to be successful only by technical analysis. You should learn best to the indicator, which you want to use, and test it on trial accounts before trading on the real account.

You can follow the steps below to add the indicator  to the MT4 platform.

Add → Indications → Trend → Bollinger Bands

 Click here to open an account and start forex trading immediately.